When people think of machine learning, they often picture complex models and the data used to train them. But there’s something even more crucial: how these models make it to the real world and start solving real problems. A model’s true power is only unleashed once it’s in production, driving decisions and creating impact. It’s not just about building smart algorithms—it’s about making them work where it matters most. That’s why model deployment is just as vital as model development.
The ML Project Life Cycle: Part 1 - From Scoping to Data Preprocessing
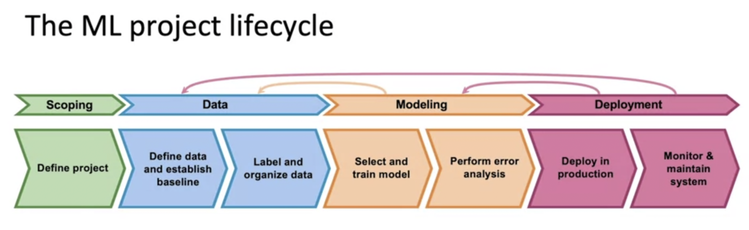
“Machine learning project is a journey, not a destination.” This is part 1 of a series exploring the Machine Learning (ML) project life cycle from start to deployment . Here, we’ll delve into the crucial initial stages, drawing on the knowledge I’ve gained from various sources.
Scoping: Defining the Project
The journey begins with scoping, the foundation upon which your ML project rests. Here, you meticulously outline the project’s goals, inputs, outputs, and any constraints that might come into play.

Key considerations:
1. Target User: who will benefit from the project?
- Demographic information (age, gender, location),Occupation or role,Interests and hobbies,Technology proficiency
2. What are their problems or pain points?
- What challenges or frustrations do they face?
- How does this problem impact their daily life or work?
3. How do they currently solve this problem?
- What methods or tools do they use?
- What are the limitations or drawbacks of their current approach?
4. How can our solution address their needs better?
- What unique benefits can our solution offer?
- How will our approach improve their efficiency, effectiveness, or satisfaction?
5. Time-frame: When does the project need to be completed?
6. Cost: What is the budget for the project?
7. Quality: What level of performance is expected from the model?
8. Input :What must be the input X to obtain the output Y?
Example:
Let’s say we have a dataset for text prediction :
| Input (X) | Output (Y) |
|---|---|
| “The quick brown fox” | “jumps” |
| “I like to eat” | “pizza” |
| “The cat sat on” | “the” |
In this example, the input sequence is a series of words, and the output is the predicted next word based on the context of the input.
Data Acquisition: The Backbone of Machine Learning
Data acquisition is the process of collecting, gathering, and preparing data for training and testing a machine learning model. This is a critical phase as the quality and quantity of data directly impact the model’s performance.Even a slight change in approach (e.g. weather data from kathmandu vs. weather data from chitwan , photos of cars taken from a street camera vs. photos of cars taken from a mobile phone) could totally change the algorithm.
Key Steps in Data Acquisition:
1. Determine Data Needs
- Determine Data Needs: Clearly define the types of data required for your machine learning task. Consider the input variables (features) and the desired output (target variable).For example, in a house price prediction model, features might include square footage, number of bedrooms, location, and year built.
- Identify Data Sources: Explore potential sources of data, such as internal databases, public datasets, APIs, web scraping, or data purchase.
2. Data Collection:
- Gather Data: Employ appropriate methods to collect the identified data. This might involve using databases, APIs, web scraping tools, sensors, surveys, or even manual data entry.Verify the accuracy, completeness, and consistency of the collected data.
3. Data Cleaning and Preprocessing:

3.1. Handle Missing Values
Address missing data points by imputation, deletion, or interpolation.
- Imputation: This involves filling in missing values with estimated values. Common imputation techniques include mean imputation, median imputation, and mode imputation.
Here i am specifically giving practical example on how to handle missing values in context of categorical data when we are dealing with tabular data for task like classification. You might encounter missing values in numeric data for which you can try mean ,median or random value without changing the meaning of data .Suppose we are working on dog ,cat.
Example:
| Animal ID | Species | Age | Weight | |
|---|---|---|---|---|
| 1 | Cat | 3 | 5 | |
| 2 | Dog | 5 | 20 | |
| 3 | Dog | 1 | 2 | |
| 4 | Dog | 2 | 15 | |
| 5 | ? | 4 | 10 |
In this example, the mode of the “species” column is “Dog.” If you use mode imputation, you would fill in the missing value in row 5 with “Dog.” classification and some of the values are missing how to handle it .
- Deletion: If there are too many missing values in a particular feature, you may choose to delete that feature.
- Interpolation: This involves estimating missing values by assuming a pattern or relationship between the existing values.
3.2. Remove Outliers:
Identify and handle outliers that can skew the model’s training.
- Identify outliers: Outliers are data points that are significantly different from the rest of the data. You can identify outliers using statistical methods or visualization techniques.
- Handle outliers: Once you’ve identified outliers, you can choose to remove them or keep them. If you decide to keep them, you may need to transform the data to reduce their impact on the model.
3.3. Normalize or Standardize Data:
Transform data to a common scale to improve model performance.
3.4. Feature Engineering:
Create new features or transform existing ones to enhance the model’s ability to learn patterns.
- Create new features: You may be able to create new features by combining existing features or by applying transformations to existing features. For example, you could create a new feature called “age” by subtracting the birth year from the current year.
Before transformation
| Birth Year | Current Year |
|---|---|
| 1990 | 2024 |
| 1995 | 2024 |
| 1985 | 2024 |
After transformation
| Birth Year | Current Year | Age |
|---|---|---|
| 1990 | 2024 | 34 |
| 1995 | 2024 | 29 |
| 1985 | 2024 | 39 |
- Transform existing features: You may need to transform existing features to make them more suitable for your machine learning model. For example, you could convert categorical variables into numerical variables using one-hot encoding or label encoding.
3.5. Data Anonymization
Cleanse sensitive data to protect privacy and comply with regulations.
- Remove personally identifiable information (PII): This includes information such as names, addresses, and social security numbers.
- Use anonymization techniques: There are a variety of anonymization techniques that can be used to protect privacy, such as generalization, suppression, and perturbation.
-
4. Exploratory Data Analysis (EDA):
- Understand Data Distribution: Analyze the distribution of data across different features to understand central tendencies and variations.
- Visualize Relationships: Use visualizations e.g., scatter plots, correlation matrices to explore relationships between features and target variables.
- Identify Patterns and Trends: Look for patterns, trends, and anomalies in the data that may inform feature selection and model development.
- Generate Summary Statistics: Calculate summary statistics such as mean, median, standard deviation, and quartiles to gain insights into the data.
5. Data Labeling:

- Annotate Data: For supervised learning, assign appropriate labels or classes to the data points. This might involve manual annotation or using automated techniques. Annotation can be done on Text Data,Image Data,Tabular Data,Sensor Data etc based on requirements and the task we are doing .Here i am illustrating more detailed explanation on how to annotate image .
- Manual annotation: In some cases, you may need to manually annotate the data. This can be time-consuming, but it may be necessary to ensure the accuracy of the labels.For annotation task i personally use roboflow ,similarly other tool that can be used is cvat.ai and other many tools which helps for annotation.
- Automated techniques: In some cases, you may be able to use automated techniques to annotate the data. However, automated techniques may not always be accurate, and you may need to manually review the annotations.
In the same way using different techniques and tools anotation can be done on various types of data as per requirement.
6. Data Splitting:
- Divide Dataset: Partition the data into training, validation, and testing sets. The training set is used to train the model, the validation set helps tune hyperparameters, and the testing set evaluates the model’s performance on unseen data.
Conclusion
This concludes part 1 of our exploration of the ML project life cycle. Stay tuned for the next part, where we’ll delve into model development and evaluation! Remember, this information is based on the knowledge I’ve acquired, and additional resources might offer even more insights.